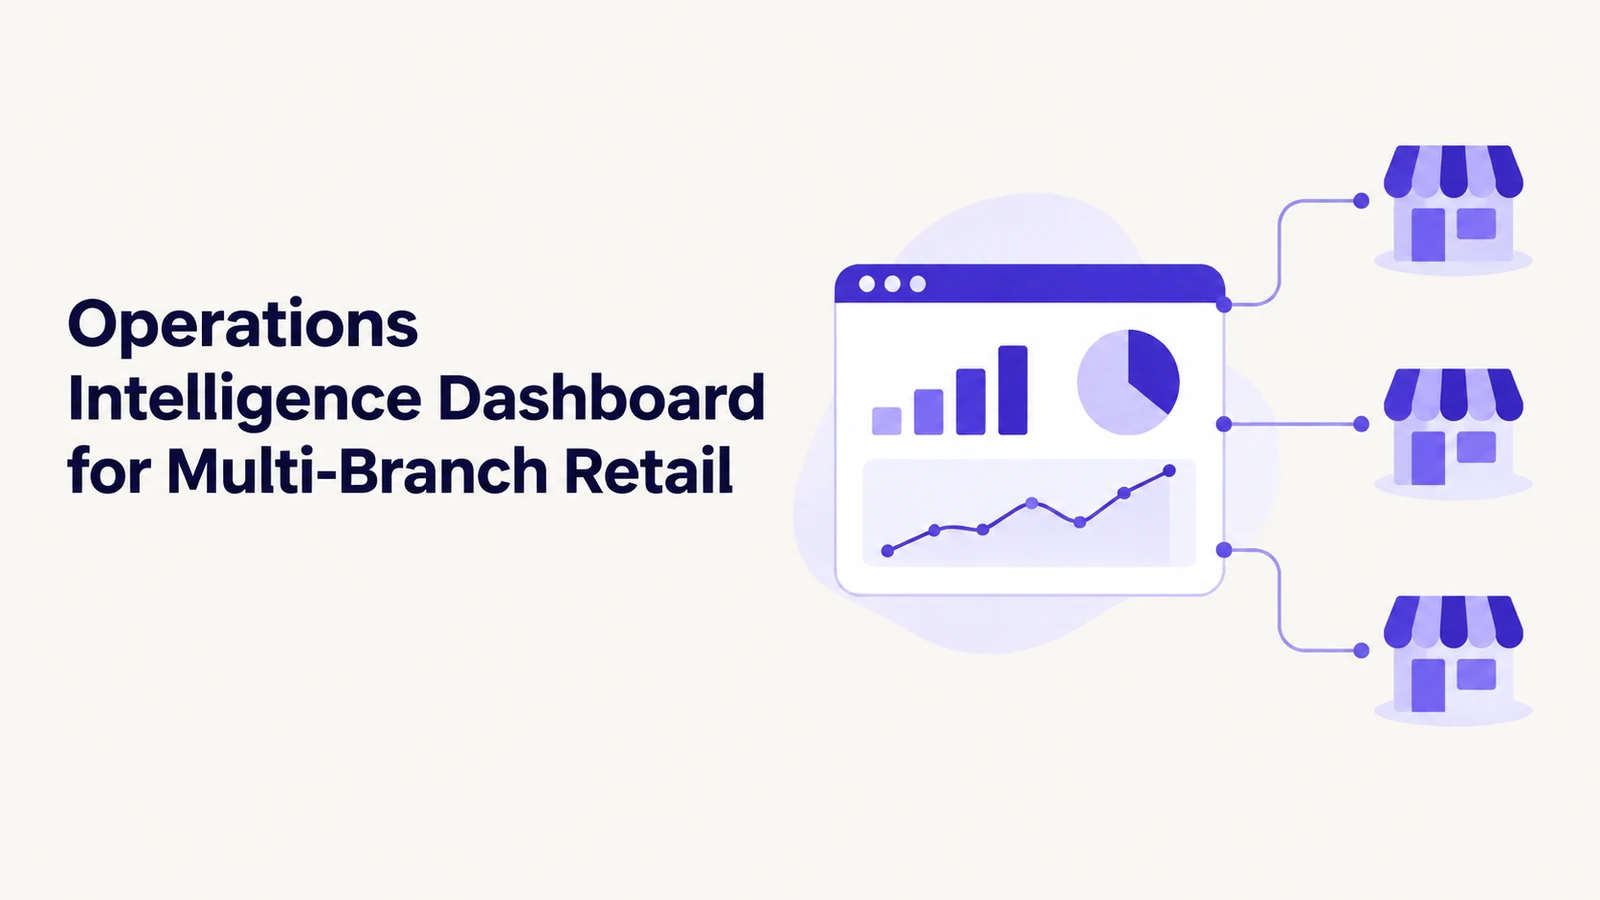
An operations intelligence dashboard for multi-branch retail brings sales, stock, customer enquiries and response times from every branch into one live view. It shows managers which branches are slipping and why, so they act the same day. People still make the decisions; the dashboard shows where to look.
It is Monday, 9 am, in Riyadh. A regional manager opens three spreadsheets, a sales report from head office and a WhatsApp group full of branch updates. One branch missed its weekend target. Another has a bestseller out of stock. Nobody knows which problem started first. By the time she finds out, the week has begun.
Why do multi-branch retailers lose sight of what is happening in each branch?
Every branch keeps its own records. Sales sit in the point-of-sale system. Stock sits in another tool. Customer enquiries arrive by phone, WhatsApp and the website, and few of them are counted. Reports are built by hand, often once a week.
That creates three gaps.
- Delay. A problem on Thursday shows up in Sunday's report.
- Blind spots. Head office sees the sales that happened, not the enquiries that never became sales.
- Inconsistency. Each branch measures things its own way, so comparisons turn into arguments.
What does an operations intelligence dashboard show a retail manager?
It shows the numbers a manager needs, for every branch, in one place. A typical view covers:
- sales against target, by branch and by day
- stock levels and items running low
- customer enquiries received, answered and still waiting
- time to first reply
- store-visit and callback requests, and how many were kept
- handovers from the chatbot to staff, and how long each waited
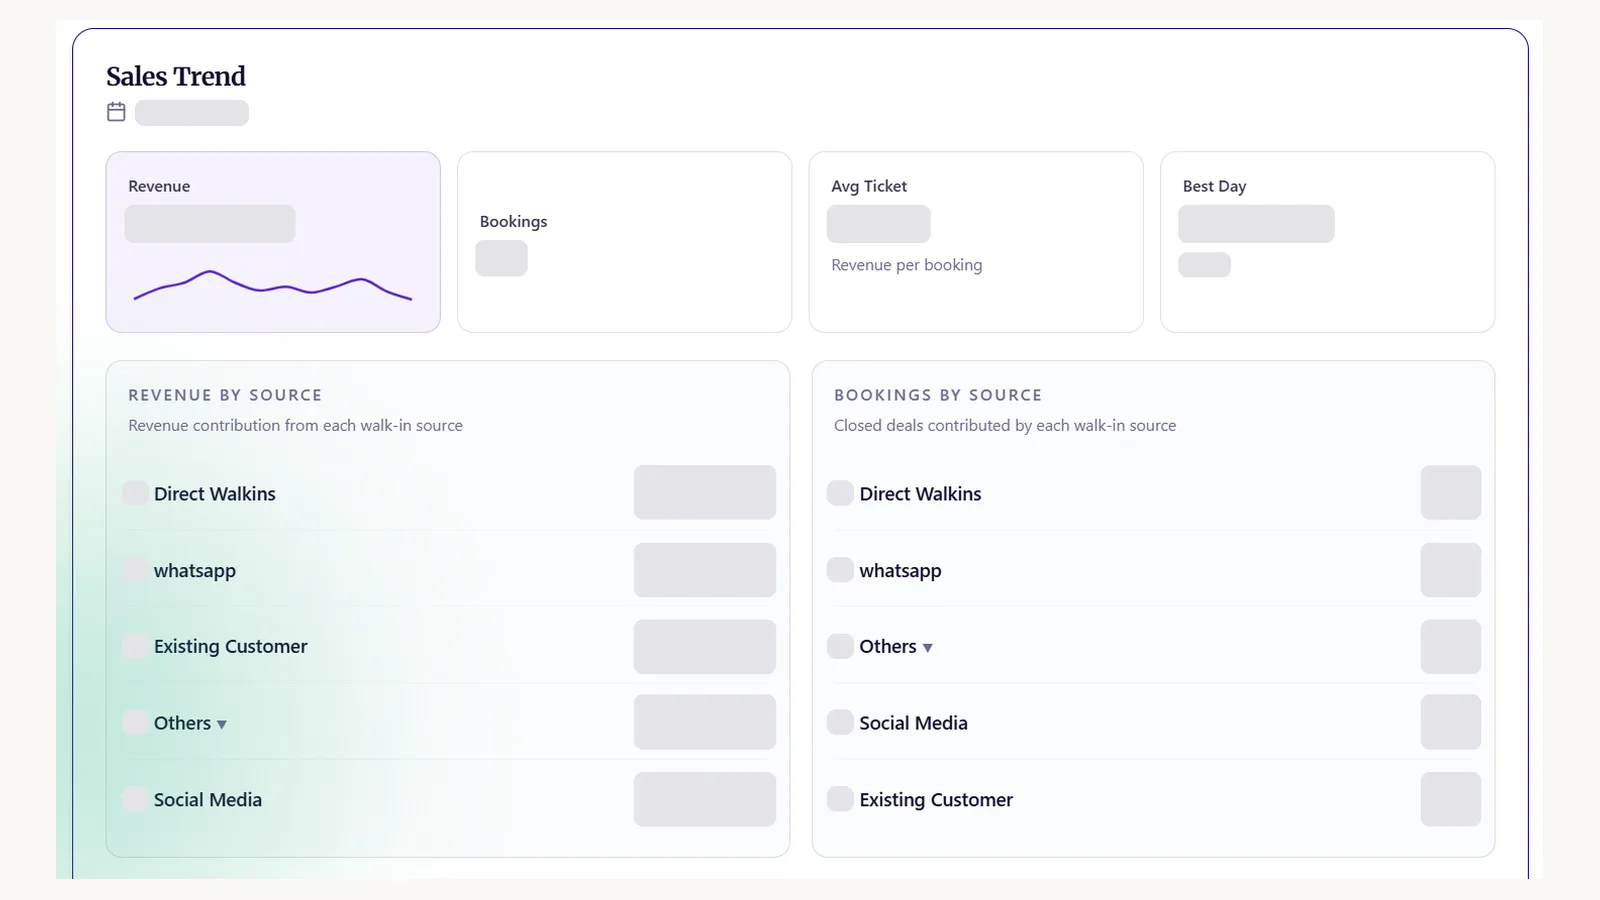
A good dashboard also explains. If one branch's conversions fall, it shows whether enquiries dropped, replies slowed or stock ran out. The manager sees the cause, not just the dip.
Where does the dashboard get its data?
It uses the systems you already run: point-of-sale, inventory, your CRM and your spreadsheets. It also uses the conversations handled by your AI web chatbot, your WhatsApp chatbot for business and your AI calling agent.
In the Gulf, many enquiries start on WhatsApp and the website together. A dashboard that ignores chat misses the front of the sales funnel.
Clara AI starts by checking which sources can be trusted. Where two systems disagree on a figure, we agree which one is the reference before any chart is built on it.
What does this look like for a real retail network?
Clara AI built this for Nilkamal Sleep, a retail network in India. Their management uses a smart dashboard to track the performance of their retail stores in real time. It monitors sales, footfall, scheme qualification and store-level KPIs across the entire network.
Leadership gets one live, consolidated view of every store. That makes it faster to decide where to act and to plan targeted interventions for the stores that need them.
Clara AI also deployed a "Virtual AI CEO" for Nilkamal Sleep. It is an AI layer that takes in business data, surfaces insights, flags underperformance and gives management executive-level recommendations. The decisions stay with their leadership.
A Gulf retailer with branches across Riyadh, Jeddah and Dubai faces the same questions: which stores are slipping, why, and what to do this week. The data sources differ, but the approach is the same.
Where does a human stay in the loop?
People make every decision. The dashboard flags a branch with slow replies or low stock, and the manager chooses what to do. Alerts go to a named person, not a general inbox.
Access follows the role. Branch staff see their own branch. Head office sees all of them. For retailers in Saudi Arabia, the PDPL (Personal Data Protection Law) governs customer details, so we limit who can see them and review that setting with you.
The dashboard shows patterns in operations. It is not built to rank individual staff.
How Clara AI gets it built
Clara AI builds, deploys and manages AI chatbots, AI calling agents and operations dashboards, for retailers and other businesses in India and the Gulf.
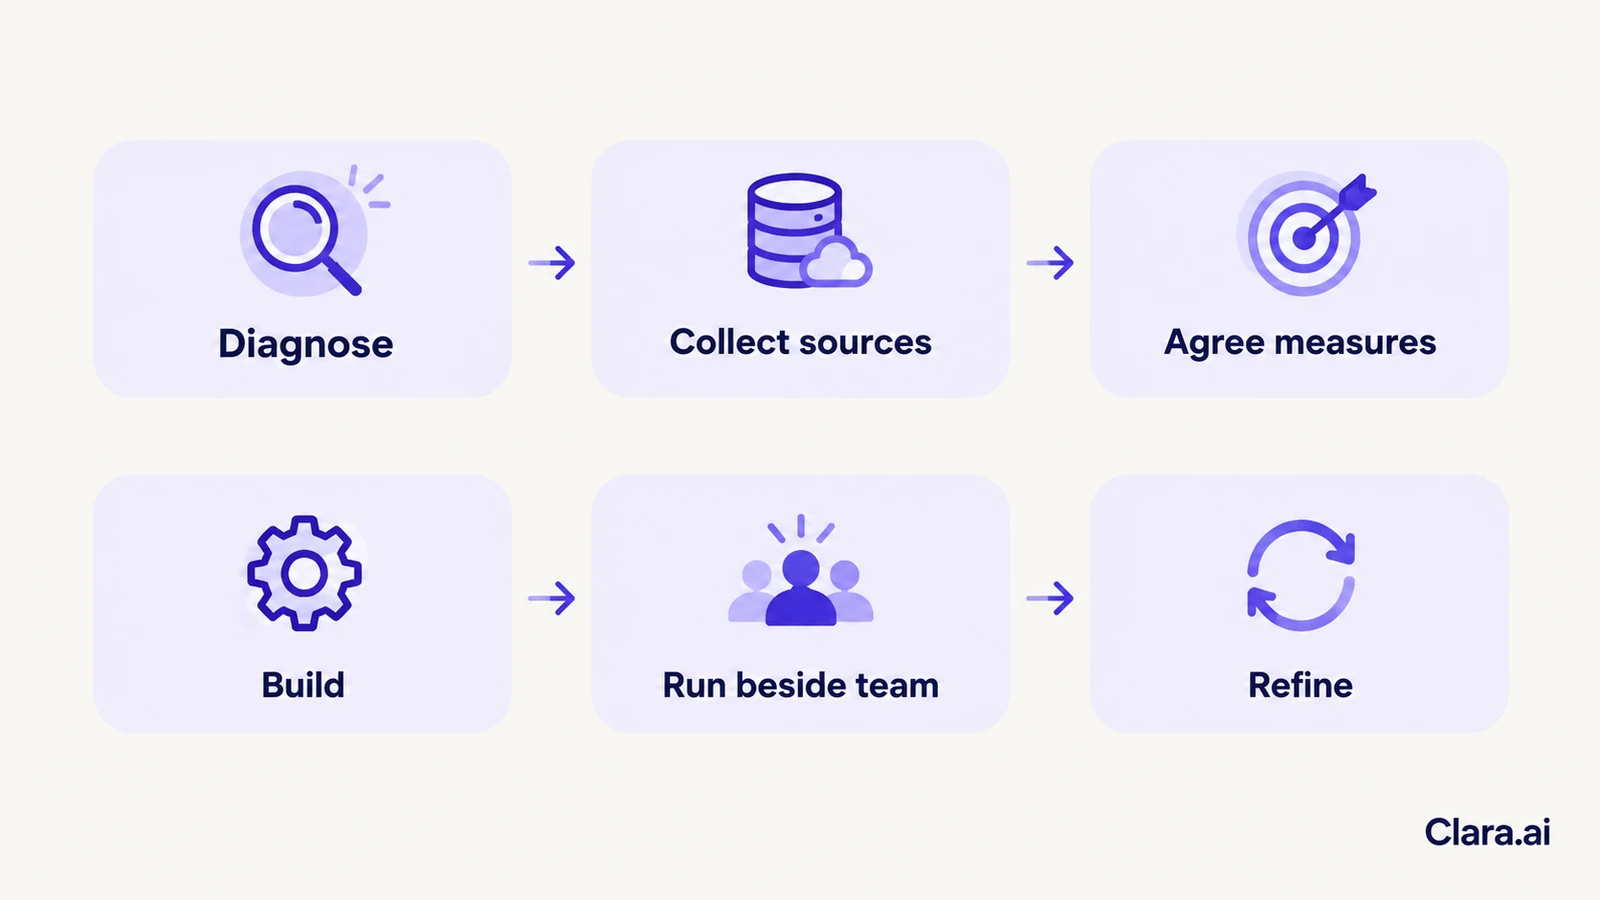
- Diagnose how reporting works today. We map who builds each report, how long it takes and where figures disagree. We measure the baseline.
- Collect your sources. You share sample exports from sales, stock and CRM. A version 1 demo is ready within 7 days of receiving your material.
- Agree the measures. Your managers choose the handful of numbers that drive decisions. We drop the rest.
- Build on your real data. Every chart is checked against figures your team already trusts.
- Run beside your team. The dashboard runs alongside your current reports until the numbers match and managers rely on it.
- Keep managing and improving. We watch usage, fix data issues and add measures as your branches change.
Questions retailers ask about operations intelligence dashboards
How much does an operations intelligence dashboard cost?
Cost depends on the number of data sources, the number of branches and the measures you want. Clara AI prices the work after diagnosis, once the scope is clear.
Can it work with the point-of-sale and CRM we already use?
Usually, yes. Most systems can export data or connect through an API. Clara AI confirms what is possible for your tools during diagnosis, before any build starts.
How is this different from the reports our BI tool already produces?
A BI tool shows what you tell it to show. This dashboard is designed around your branch operations, including enquiries and response times that many BI setups leave out. It can sit on top of your existing reporting.
Do we need a chatbot first?
No. The dashboard works from sales, stock and CRM data alone. Adding a chatbot or calling agent gives it enquiry data as well.
Who sees the dashboard?
You decide. Most retailers give branch managers their own branch, regional managers their region and head office the full picture.